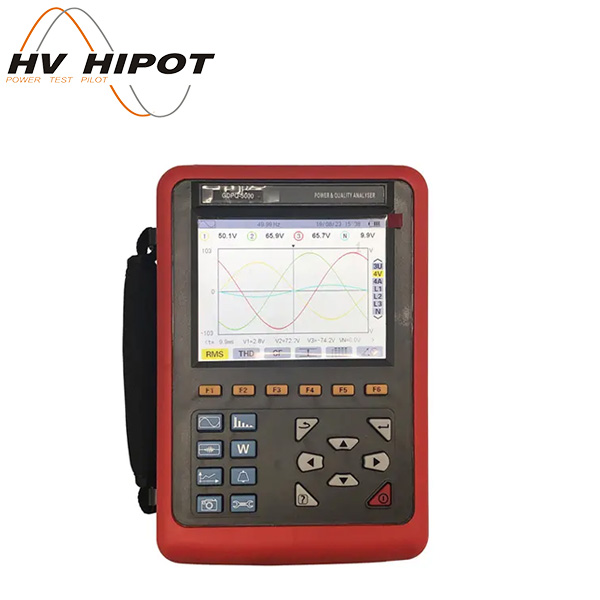
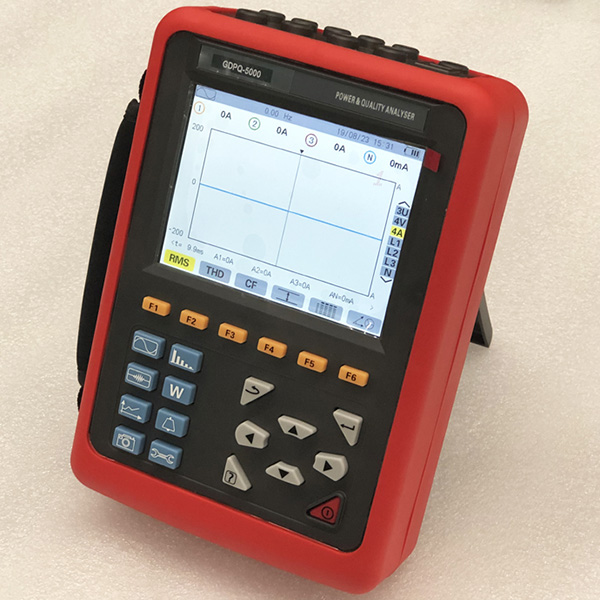
GDPQ-5000 Power Quality Analyzer
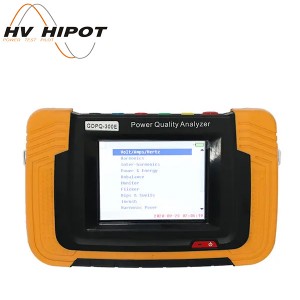
GDPQ-5000 Power Quality Analyzer is a comprehensive test instrument carefully developed by our company and specially designed for field test of three phases, multi-functional and intelligent, concise man-machine operation. It is easy to use, large LCD screen display, high resolution, interface in both Chinese and English, shock-proof shell structure and so on. Can simultaneously measure the 4-channel current (ABC three phase and neutral wire current), 4-channel voltage (ABC three-phase voltage and neutral line voltage to ground), the peak value of current voltage, maximum/minimum value over a period, three-phase imbalance factor, short-time voltage flicker, transformer K factor, active power, reactive power, apparent power, power factor and displacement power factor, active power, reactive power, apparent power, total harmonic distortion and harmonic, etc; Display real-time waveform, harmonic ratio bar charts of current voltage; Dynamically capture instantaneous change of voltage current, monitoring starting current, monitoring the power parameters and generate the alarm list, generate the trend chart for a long time record test data.
GDPQ-5000 Power quality analyser adopt DSP + ARM double processor architecture, DSP is use for data collection and the processing of algorithm, the ARM is use for the communication protocol and the man-machine interface processing; Analog signal acquisition is by 2 pieces AD7655 of ADI company. Resolution for AD7655 is 16 bit and it is 4 channel synchronous sampling. The highest sampling rate can reach 1 MSPS, to ensure the accuracy of the channel and the information integrity, and wouldn’t miss any transient changes in the grid, can more accurate to detect the transient waveform rising and dropping drastically, and waveform instantaneous interrupt; DSP working frequency is over 200 MHZ, to be able to timely monitoring of the power grid and dynamically adjust the sampling frequency to realize synchronization of power frequency and sampling frequency; Using a 5.6 -inch LCD color screen display, a resolution of 640 dots x 480 dots, with different display color difference between the parameters of phase, waveform, vector diagram, harmonic ratio, the user can be more efficient and more intuitive understand the state of power grid parameters. Built-in flash memory can store 60 group of screenshots at the same time, 150 groups of capture transient voltage/current waveform figure, and 12800 groups of alarm list. Starting current detection model can continuously capture starting current waveform for 100 s. Built-in 2G memory card to store the trend curve record, simultaneous recording 20 parameters (can choose according to need) collect data for once every five seconds, trend curve records can be stored for 300 days.
It is also called Intelligent Three Phase Power Quality Analyser, Multifunctional Power Quality Analyser, which simultaneous with the functions of harmonic analyser, phase volt-ampere meter,?electric parameter tester. It apply to electricity industry, petrochemical, metallurgy, railway, mining enterprises, scientific research institution, metrological department. Especially suitable for comprehensive analysis and diagnosis on all the voltage, current, power, power, harmonic, phase electric parameters.
2.1. Measurement function
● Waveform real-time display (4 channels voltage/4 channels current).
● True RMS values of voltages and currents.
● The DC components of voltages.
● Peak current and voltage values.
● Minimum and maximum half-cycle RMS current and voltage values.
● Phasor diagram display.
● Measurement of each harmonic up to order 50.
● Bar charts show harmonic ratios of current and voltage of each phase.
● Total harmonic distortion (THD).
● Active, reactive, apparent power, by phase and cumulative.
● Active, reactive, apparent energy, by phase and cumulative.
● Transformer K factor.
● Power factors (PF) and displacement factors (DPF or COSΦ).
● Short-term voltage flicker (PST).
● Three phase unbalance(current and voltage).
2.2. Transient capture function
Monitoring instantaneous change of power grid voltage current parameters, including the voltage current fluctuations, voltage current surge, sag and short supply interruption, temporary overvoltage, impact current and Current voltage instantaneous distortion. Instruments can store 150 sets of transient waveform at the same time.
2.3. Starting current monitoring
Monitoring surge current of line and the startup current when electrical equipment is starting, help to correctly design capacity. Can be display the RMS rising / falling curve In the startup process, the envelope curve of startup current, waveform of 4 channels current and 4 channels voltage. Recording about 100s after trigger, storage the current /voltage instantaneous and waveform curve of each cycle in 100s.
2.4. Trend chart recording and storing function
Store all the test parameters of basic test functions (Urms, Uthd, Ucf, Uunb, Hz, Vrms, Vthd, Vcf, Vunb, PST, Arms, Athd, Acf, Aunb, KF,W, VAR, VA, PF, COSφ, TANφ),50 voltage harmonics, 50 current harmonics. And create the trend curve. Record data for a long time according to need(concurrent selection 20 parameters to record data for once every five seconds, you can record about 300 days.).
2.5. Alarm function
Set the limit values according to need, monitoring the values whether overshoot, if overshoot will generate an alarm log, such as: voltage, current, unbalance, harmonic ratio, frequency, active power, total harmonic distortion. You can configure 40 different alarms, each group can set different monitoring parameters (including 50 harmonics, total of 123 different parameters) and limit values, also can set the shortest time of overshoot. The log can contain up to 12,800 alarms.
2.6. Snapshot function
Any screen can be saved(screen snapshot), at the same time automatically records the time and test mode. Such as can save voltage and current waveform, harmonic bar chart, phasor diagram?etc. It can save a maximum of 60 screen snapshot.
2.7. Communication function
Communicate with computer via USB, Monitoring software can display waveform of power quality analysis, read of the transient waveform, trend chart recording, alarm log, screenshots, and display on the computer.
2.8. Setting function
The user can configuration of the time and date, configuration of the screen contrast and brightness, definition of each phase curve colours.
Choice of type of connection to the network.
Configuration of the type of the current sensors and voltage ratios.
2.9. Help menu
Every stage of operation can press the "help" key to obtain relevant information.
3.1. Base condition and working condition
| cInfluence factor | Test item | Base condition | Working condition |
| Environment temperature | All parameters | (23±2)°C | -10°C~ 40°C |
| Relative humidity | All parameters | 40%~ 60% | <80% |
| Phase-to-neutral voltage | All parameters | (100±1%)V | 1.0V~ 1000V |
| Phase-to-phase voltage | True RMS phase-to-phase voltage | (200±1%)V | 1.0V~ 2000V |
| Current | True RMS current | (5±1%)A | 10mA~ 10A |
| Network frequency | All parameters | 50Hz±0.1Hz | 40Hz~ 70Hz |
| Phase shift | Active power and active energy | Cosφ=1 | Cosφ: 0.2~ 1.0 |
| Reactive power and reactive energy | Sinφ=1 | Sinφ: 0.2~ 1.0 | |
| Harmonic | All parameters | <0.1% | 0.0%~ 100% |
| Voltage unbalance | All parameters | <10% | 0.0%~ 100% |
| Working voltage of device | All parameters | DC9.8V±0.1V | DC9.5V~ 10.5V |
| External electric field, magnetic field |
All parameters | Should be avoided | |
| Test position | Measured related parameters of current | Tested wire at the center of clamp. | |
3.2. General specification
| Power supply | Rechargeable lithium-ion battery pack 9.6V, backup charger. |
| Battery indicator | Battery symbol ??????shows dump energy. When the voltage is too low, automatic shutdown after the 1 minute. |
| Power consumption | Current consumption of normal test 490 mA, continuous working for 8 hours. |
| Display mode | LCD color screen, 640dots×480dots, 5.6 inches, display domain: 116mm×88mm. |
| Size of clamp | 008B small sharp current clamp: 7.5mm×13mm; |
| Instrument dimensions | L×W×H: 240mm×170mm×68 mm. |
| Number of channels | 4U/4I. |
| Phase-to phase voltage | 1.0V~2000V. |
| Phase-to-neutral voltage | 1.0V~1000V. |
| Current | 008B current clamp: 10mA~10.0A; |
| Frequency | 40Hz~70Hz. |
| Parameters of electricity | W, VA, Var, PF, DPF, cosφ, tanφ. |
| Energy parameters | Wh, Varh, Vah. |
| Harmonic | Order 0~50. |
| Total harmonic distortion | Order 0~50, each phase. |
| Expert mode | Yes. |
| Number of Transient records | 150 sets. |
| Voltage flicker | Yes. |
| Starting current mode | Yes, 100 seconds. |
| 3 phases unbalance | Yes. |
| Record | 300 days(simultaneous recording 20 parameters, record one point every 5 seconds). |
| Min/Max recorded value | Measurement of maximum and minimum values over a period of time. |
| Alarm | 40 different types of parameter selections, 12,800 sets alarm logs. |
| Peak | Yes. |
| Phasor diagram display | Automatically. |
| Capacity of snapshots | 60. |
| Menu language | English |
| Communication | USB. |
| Automatic switching off | When an alarm campaign is initiated or a search for transients, an inrush current capture, or a trend recording is pending or in progress, the device is not automatic switching off. |
| In other test mode, 15 minutes without keystrokes, automatic shutdown after prompt 1 minute. | |
| Backlight function | Yes, suitable for use at night and dark place. |
| Weight | Host: 1.6kg (with battery). |
| 008B small sharp current clamp: 170g×4; | |
| Length of voltage test wire | 3m. |
| Length of current sensor wire | 2m. |
| Working temperature and humidity | -10°C~40°C; below 80%Rh. |
| Storage temperature and humidity | -10°C~60°C; below 70%Rh. |
| Input impedance | Input impedance of test voltage: 1MΩ. |
| Withstand voltage | Withstand 3700V/50Hz sinusoidal AC voltage for 1 minute between instrument wiring and shell. |
| Insulation | Between instrument wiring and shell ≥10MΩ. |
| Structure | Double insulation, with insulation vibration-proof sheath. |
| Safely rules | IEC 61010 1000V Cat III / 600V CAT IV, IEC61010-031, IEC61326, Pollution degree: 2. |
3.3. Instrument precision (excluding the current sensor)
Respectively introduce the following data (on the basic of base conditions and the ideal current sensors, perfectly linear, no phase shift).
| Measurement | Range | Display resolution | The maximum error in the range of the reference |
| Frequency | 40Hz~ 70Hz | 0.01Hz | ±(0.03)Hz |
| True RMS phase-to-neutral voltage | 1.0V~ 1000V | Min resolution 0.1V | ±(0.5%+5dgt) |
| True RMS phase-to phase voltage | 1.0V~ 2000V | Min resolution 0.1V | ±(0.5%+5dgt) |
| DC voltage | 1.0V~ 1000V | Min resolution 0.1V | ±(1.0%+5dgt) |
| True RMS current | 10mA~ 10A | Min resolution 1mA | ±(0.5%+5dgt) |
| Peak of phase-to-neutral voltage | 1.0V~ 1414V | Min resolution 0.1V | ±(1.0%+5dgt) |
| Peak of phase-to-phase voltage | 1.0V~ 2828V | Min resolution 0.1V | ±(1.0%+5dgt) |
| Current peak | 10mA~ 10A | Min resolution 1mA | ±(1.0%+5dgt) |
| Peak factor | 1.00~ 3.99 | 0.01 | ±(1%+2dgt) |
| 4.00~ 9.99 | 0.01 | ±(5%+2dgt) | |
| Active power | 0.000W~ 9.999kW | Min resolution 0.001W | ±(1%+3dgt) Cosφ≥0.8 |
| ±(1.5%+10dgt) 0.2≤Cosφ<0.8 |
|||
| Reactive power, inductive or capacitive | 0.000VAR~ 9.999kVAR |
Min resolution 0.001VAR | ±(1%+3dgt) Sinφ≥0.5 |
| ±(1.5%+10dgt) 0.2≤Sinφ<0.5 |
|||
| Apparent power | 0.000VA~ 9.999kVA |
Min resolution 0.001VA | ±(1%+3dgt) |
| Power factor | -1.000~ 1.000 | 0.001 | ±(1.5%+3dgt) Cosφ≥0.5 |
| ±(1.5%+10dgt) 0.2≤Cosφ<0.5 |
|||
| Active energy | 0.000Wh~ 9999.9MWh | Min resolution 0.001Wh | ±(1%+3dgt) Cosφ≥0.8 |
| ±(1.5%+10dgt) 0.2≤Cosφ<0.8 |
|||
| Reactive energy, inductive or capacitive | 0.000VARh~ 9999.9MVARh |
Min resolution 0.001VARh | ±(1%+3dgt) Sinφ≥0.5 |
| ±(1.5%+10dgt) 0.2≤Sinφ<0.5 |
|||
| Papparent energy | 0.000VAh~ 9999.9MVAh |
Min resolution 0.001VAh | ±(1%+3dgt) |
| Phase angle | -179°~ 180° | 1° | ±(2°) |
| Tanφ (VA≥50VA) |
-32.76~ 32.76 | Min resolution 0.001 | φ:±(1°) |
| Phase shift of power factor (DPF) |
-1.000~ 1.000 | 0.001 | φ:±(1°) |
| Harmonic ratio (order 1 to 50)?(Vrms>50V) |
0.0%~ 99.9% | 0.1% | ±(1%+5dgt) |
| Harmonic angle (Vrms>50V) |
-179°~ 180° | 1° | ±(3°)?harmonics of order 1 to 25 |
| ±(10°)?harmonics of order 26 to 50 | |||
| Total harmonic?ratio (THD or THD-F)≤50 |
0.0%~ 99.9% | 0.1% | ±(1%+5dgt) |
| Distortion factor (DF or THD-R)≤50 |
0.0%~ 99.9% | 0.1% | ±(1%+10dgt) |
| Transformer K factor | 1.00~ 99.99 | 0.01 | ±(5%) |
| 3 phases unbalance | 0.0%~ 100% | 0.1% | ±(1%) |
3.4. Current sensor character
| Type of current sensor | True RMS current | Max error of true RMS current | Max error of phase angle?φ |
| ??008B current clamp | 10mA~ 99mA | ±(1%+3dgt) | ±(1.5°),Arms≥20mA |
| 100mA~ 10.0A | ±(1%+3dgt) | ±(1°) | |
| 040B current clamp | 0.10A~ 0.99A | ±(1%+3dgt) | ±(1.5°) |
| 1.00A ~100A | ±(1%+3dgt) | ±(1°) | |
| 068B current clamp | 1.0A ~9.9A | ±(2%+3dgt) | ±(3°) |
| 10.0A ~1000A | ±(2%+3dgt) | ±(2°) | |
| 300F?current clamp | 10A ~99A | ±(1%+3dgt) | ±(3°) |
| 100A~3000A | ±(1%+3dgt) | ±(2°) |
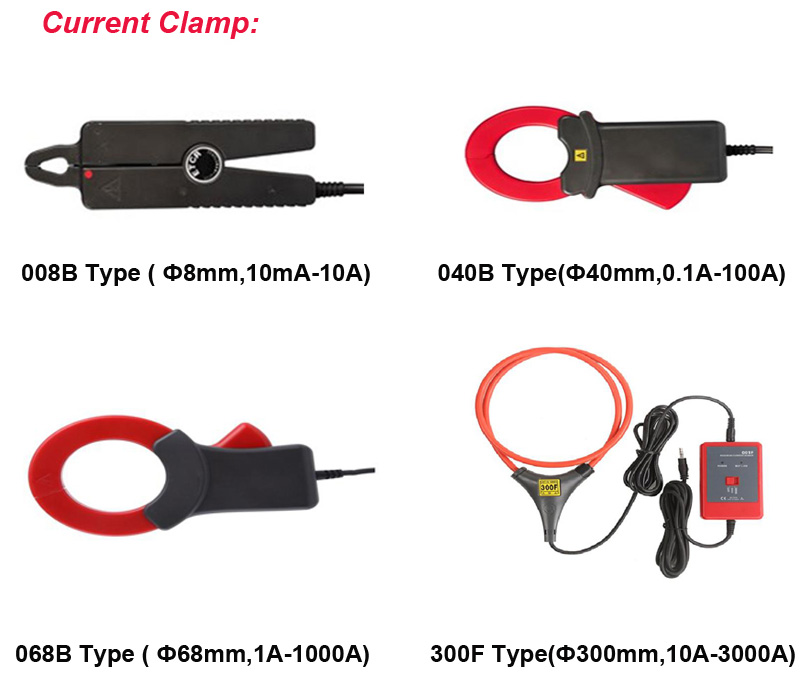
Note: current clamp and instruments must be connected to the corresponding, cannot be inserted opposite.
4.1. Standard configuration
|
No. |
Designation |
Quantity |
|
1 |
Instrument host. |
1 |
|
2 |
Instrument bag. |
1 |
|
3 |
Current sensors. |
12 (3 kinds) |
|
4 |
Testing wires. |
5?(yellow,?green,?red,?blue,?black) |
|
5 |
Crocodile clips. |
5 |
|
6 |
Test probe. |
5 |
|
7 |
Dedicated power adapter. |
1 |
|
8 |
USB date cord. |
1 |
|
9 |
Software CD. |
1 |
|
10 |
Lithium battery pack. |
1(Built into the instrument) |
|
11 |
2GB memory. |
1(Plug in the instrument) |
|
12 |
Manual, warranty card, certification. |
1 |
4.2. Weight
|
No. |
Designation |
Weight |
|
1 |
Instrument host. |
1.6Kg (with battery). |
|
2 |
008B small sharp current clamp. |
170g*4. |
|
3 |
040B round?current clamp. |
185g*4 |
|
4 |
068B round?current clamp. |
530g*4 |
|
5 |
300F Flexible coil current clamp?(with integrator). |
330g*4 |
|
6 |
Test wires and power adapter. |
900g. |

